Diversity, Data and Donations: Key Findings to Maximize Your Donor Base
When I was the Associate Director of Donor Services and Operations at Free The Children (now www.We.org), I had the opportunity to work with Nielsen (http://www.nielsen.com/ca/en.html). Nielsen, an international consumer research and data analytics firm, conducted a pro bono project for our organization as part of their annual charitable giving day which benefitted their corporate social responsibility model. It proved to be one of the most exciting collaborations I have worked on in terms of data analytics.
Nielsen segments Canadian consumers into five distinct categories based on consumer behaviours. The Consumer blog, “Using Consumer Segments to Unlock Potential Wins in the Non-Profit Sector” suggests:
“It’s important to understand consumer segments and which emotional and rational characteristics contribute to their decision-making processes. That means digging into a cohesive blend of tangible and intangible elements that create powerful bonds between consumers and non-profit brands – bonds that make these brands not only important, but personally relevant” (2016)
This reveals one of the key aspects of fundraising: connection to the donor’s needs and desires. Why do donors give? What motivates them to give? And, why do they choose to give to a particular charity? The answers to these questions can be found in your organization’s data.
Integrating Consumer Research and Donor Data
My team knew that we wanted to broaden and nuance our approach to donors, but we weren’t certain how. We also knew that there were donors we were missing in our communities, at our events, at points of sale and we wanted to reach them in a way that motivated them to get involved and to give. When Nielsen’s rep reached out to me I jumped at the opportunity to have our data analyzed by the firm. Not only was our in-house database analyzed, it was cross-referenced against current market research on groups of people across Canada.
The results were stunning. Not only did the analytics help us connect with donors we were overlooking, but we engaged these donors in ways that were immediately profitable for the charity. Through the process, we identified several trends that we had not explored previously and were able to adjust our fundraising programs by adapting accordingly.
Here’s how we improved our fundraising programs and achieved profitable, mission-driven results by strategically using the data.
Point of Sale Donations from Unexpected Places
Notably, we learned that a host of small, independently owned grocery stores in Toronto and the GTA collected a significantly higher volume of point of sale donations for us than almost any other segment in the region. When we did a “deep-dive” into the data we found that small grocers we held partnerships with and which were operated by Middle Eastern, Indian, Bangladeshi, Asian and African owners, had customers who were more inclined to donate at the point of sale than at more mainstream grocers, such as Sobey’s where we held an existing partnership. These remarkable findings allowed us to target and enhance smaller point-of-sale donation programs at these identified grocers which increased our cash-flows.
It also told us that our mission resonated with consumers of these independent grocers, which led us to investigate these neighbourhoods further and to draw conclusions between our mission, the work we did in Canada and abroad, and the populations of people within these communities. At the time, our Adopt a Village international development model (now We Villages) operated in rural China, Nicaragua, Kenya, Sierra Leone, Haiti, India and Ecuador. Meaning the work we did to fulfill our charitable mission spoke to the hearts and minds of Canadians and newcomers who lived, worked and shopped in communities in which the independent grocers operated. They were more likely to give at the point of sale to causes that represented their cultural values and which impacted their home communities.
Co-Branding Initiatives
Initially, Free The Children had an existing partnership in 2012 with Campbell’s Canada on the charitable program targeted at elementary school students called, We Scare Hunger. The organization produced interactive posters for schools that integrated a co-branded logo between Free The Children and Campbell’s Canada. In tandem with Free The Children’s retail partner, Longo’s, the purpose of the campaign was to raise awareness of the need for food donations during the Hallowe’en season.
We subsequently found that people who donated to us also purchased specific magazines and food items. For instance, those who donated to our cause were more likely as consumers to buy Today’s Parent magazine, Canadian Family magazine, Campbell’s Soup and Robin Hood Flour (The J.M. Smucker Company), Pampers products (Procter and Gamble), and much more. This enabled our Corporate Sponsorship team to utilize the data to cultivate relationships and partnerships that have come to fruition by creating cash flows both through co-branding initiatives on these and related items, and creating innovative symbolic giving campaigns at the point-of-sale.
Never Underestimate the Power of a Toonie
Lastly, we found that children, youth and low-income adults and seniors were more likely to give more often at smaller price points. We found that Black, Middle Eastern, Asian, Hispanic, Latino/Latina/Latinx, First Nations and Aboriginal, and Caucasian populations from some of Toronto and the GTAs most notably impoverished and socio-economically diverse areas found it in their budget to make donations between $5 – $25 per month, or between $5 – $25 annually – but, that they did so consistently year over year. Some, for decades.
For me, this was proof of the need to diversify the “eggs in our baskets”, so to speak. I find that charities often get stuck by purely focusing on major donors. But, without annual donors to create sustainable, reliable cash flow, organizations can run into troubles by putting “all their eggs in one basket”. Instead, be like a squirrel and hide your food in fences, in holes, in sheds, up trees and in the eaves trough. Don’t put them all under the deck because it may get cleaned up and then you’ll have no food for the long winter months.
The data showed us that our charitable message resonated with those who were socio-economically marginalized, with those struggling with class and social standing, as well as with newcomers to Canada. Therefore, we tailored our direct mail appeals to reflect the diversity of our donors through photos, key messages and stories that reflected back to them the struggles both nationally, and internationally that would appeal to their own lived experiences and that were part of the mission and vision of our charitable activities. And, we included price points that reflected their capacity to give with the potential for an upgrade.
When someone gives $5 per month, we may ask them to increase their gift by a range of $2 to $5, versus a larger gift of $25 per month, which may not be financially feasible for them due to their income level, budget and pension amount. Overall, this contributed to our stability and sustainability as a charity because it was a way to maximize cash flow and to show donors that their gift – no matter the size – is important to us. People want to give. Our job as fundraisers is to make giving as easy as possible.
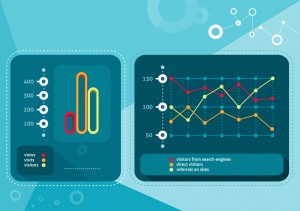
Data, CRMs and the Concept of the “Diversity Dashboard”
Another thought-provoking model for diversity in data I found was from Cornell University. Their Division of Budget and Planning uses what they call a “Diversity Dashboard” which effectively compiles statistics based on their campus-wide diversity initiatives to maximize their operations based on four key principles: “composition, engagement, inclusion, and achievement”. While this is clearly applicable to the academic sector, adapting this model for the fundraising and charitable giving sector would be a revolution in data to support decision-making in inclusive fundraising.
For instance, your customized “Diversity Dashboard” may give senior management, or those steering projects and programs within your organization, a snapshot of the daily, weekly and/or monthly trends in donor giving as compared across market research trends real-time. Being able to see the key demographics, regional activity, donation trends, etc., behind the donations you collect (all in one place), while having the ability to compare and contrast your internal data across market research trends could allow for a more robust and responsive fundraising program. And, it would inform decision-making processes across your organization.
While we did not apply this concept in my department (due to the developer time it would take to customize such a tool), we did discuss creating dashboards when we were integrating our data systems across our internal platforms. Such a project would require a careful look at what “diversity” and “inclusion” inputs and outputs would be relevant to assess on an ongoing basis.
While Cornell’s focus is inclusion of the involvement of students in campus life and the quality of their educational experiences, surveys from donors infused with a deep-dive analysis of organizational databases could prove to enhance fundraising programs by providing access to “diversity data” real-time. As soon as data is uploaded to a CRM the Diversity Dashboard could pull and segment data on the diversity of donors based on data sets. Additionally, the real-time collection and monitoring of “diversity data” lends itself to creating more inclusive landscapes for fundraisers and donors alike. While this is a concept, it perhaps could be piloted by larger, more established organizations with customized donor systems, time and resources.
Diversity Data – What You Can Do Today
While not all charities have the ability to afford to work with organizations such as Nielsen, phone around. Make the call. See if you can get your data analyzed by their pro bono charitable offerings. Working with a charity pro bono is part of many market research firms’ corporate social responsibility models, and pro bono work with charities looks good on them. And, as the golden rule of fundraising prevails, “ask and you shall receive”. You may find that your fundraising programs are transformed through the untapped potential of your own “diversity data”.
Sources:
Diversity Dashboards. Cornell University, Division of Budget and Planning.
“Diversity and Inclusion: An update on our data”


